Q: 1
INCOME: 1. Money from fund raising programmers, 2. Grant from the government, 3. Contributions from individuals, 4. Contributions from corporations, 5. Contributions as commodities. EXPENDITURE: 1. Education of the illiterate, 2. Food for the poor, 3.Management and salary of staff and 4. Expenses to organize fund-raising programmers above charts show the amounts of an NGO where Income for the year 1998-1999 = $ 55 Man and Expenditure for the same year = $54Mn.

1. What percentage of the total expenditure does management and salary account for?
1. 30%
2. 3%
3. 8.3%
4. 3.4%
5. 5.7%
Answer: 3
Explanation :( 100/360) (30) =8.3% Alternate method: The total money spent for management and salary = (30/360) x54 = 4.5 million. The percentage of this in the expenditure = (4.5/100)/54 = 8.3%.
2. Approximately what percentage of the money is saved?
1. 2%
2. 3%
3. 1%
4. 10%
5. 100%
Answer: 1
Explanation: The saved money is 55-54=1million. Required percentage = (1/55) (100) = 20/11 = 1.81%. It is approximately 2%.
Q: 2

1. From 1972 to 1974 the fares collected from subways increased by what percentage?
1. 10%
2. 12%
3. 15%
4. 16 2/3%
5. 25%
Answer: 4
Explanation: The fares collected from subways in 1972 and 1974 are 300mn and 350mn. The increase is 350-300=50mn. The percentage increase =(50)(100/300)=50/3 = 16 2/3%.
2. From 1972 to 1977 what was the average fare collected by buses per year?
1. 225
2. 250
3. 260
4. 275
5. 300
Answer: 4
Explanation: From 1972 to 1977 the collection of fares was (275+300+325+300+225+225)=1650mn. The average fares collected per year =1650/6)=275
Q:3
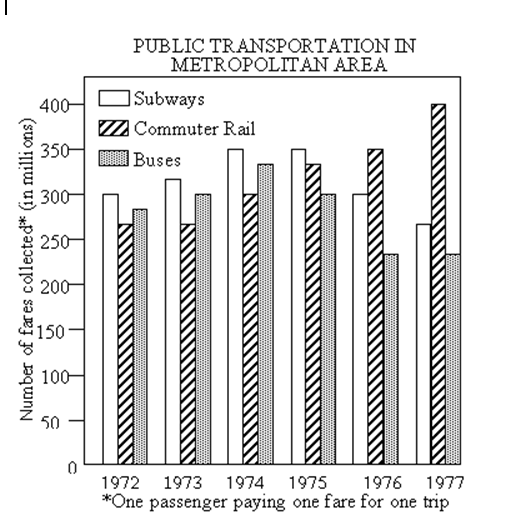
1. The fares collected from commuter rail in 1977 was what percent of fares collected from all sources in 1977?
1. 200%
2. 100%
3. 50%
4. 28%
5. 12%
Answer : 3
Explanation :The rail fare collected in 1977 was 400. Total number of fares collected from all sources in 1977 was 220+400+180=800. Therefore rail fare collected in 1977 was (400)(100/800)=50% of the fares collected from all sources.
2. Which of the following can be inferred from the graph? I) the fares collected by commuter rail were maximum in 1977. II) There was approximately 10% hike in fares collected by subways from 1973 to 1974. III) There are three years in which fares collected by subways in a particular year were greater than the fares collected in its preceding year.
1. I only
2. II only
3. III only
4. I & II
5. I,II & III
Answer: 4
Explanation: I am true. It is clear from the graph. II is true. (100/300)(30)=10%.) III is False since there are only 2 such years.
Q:4

1. If the GDP of the world was 100 in 1991 how much would it have been in the beginning of 1993?
1. 105.2675
2. 105.2
3. 104.3
4. 103.375
5. 103.2
Answer : 1
Explanation :GDP of the world in 1992 was 100+2.5=102.5. GDP of the world in 1993 beginning was 102.5+((102.5/100)x2.7)=102.5+2.77=105.27
2. Which of the following regions or types of countries showed the highest annual average rate of growth in the nineties ?
1. Asia
2. Africa
3. Other advanced countries
4. Middle East and Europe
5. Major Industrial countries
Answer : 1
Explanation :It is clear from the chart that for Asia the growth rates of GDP during nineties are comparatively higher than the other areas.
No comments:
Post a Comment